Backtesting
Backtesting is the process testing a system’s performances on past data. It uses recorded data of cryptocurrency or stock markets. Learn more about backtesting on investopedia.
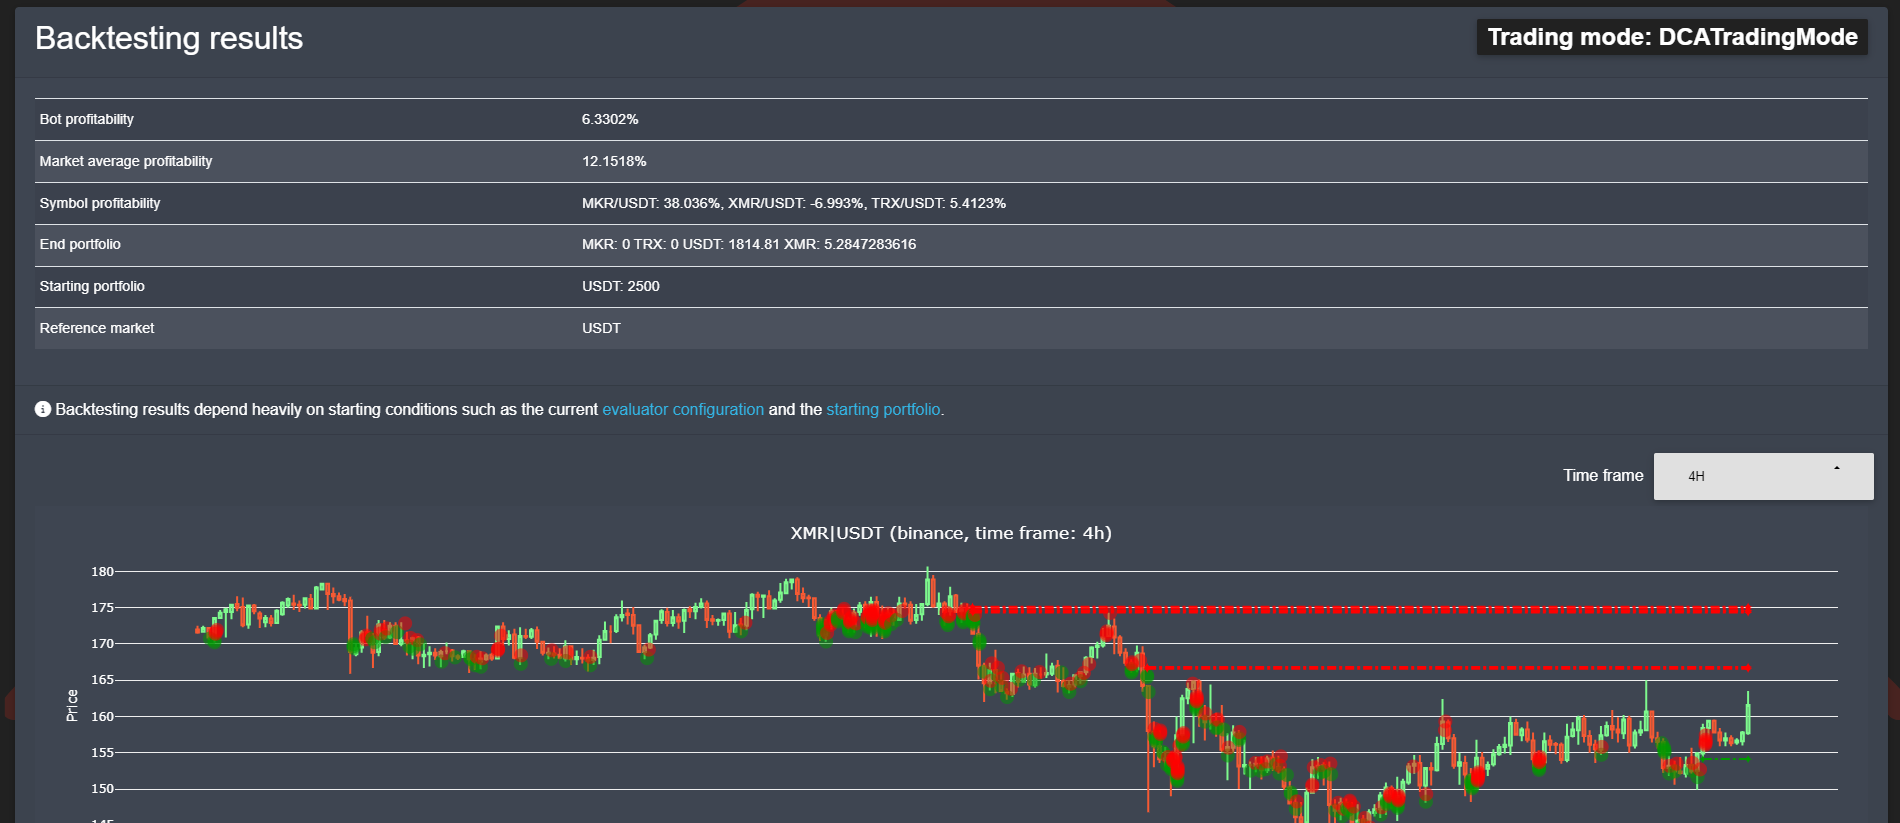
In OctoBot, backtesting is a key tool to quickly test and optimize your strategies in a risk-free environment. It enables you to execute your strategy by replaying a past scenario and identify the best settings for your traded markets.
Backtesting a trading strategy in OctoBot
OctoBot includes a backtesting engine that can quickly execute OctoBot trading strategies on historical data. To backtest a strategy, all you need is to:
- Select the profile to test in profile selector.
- Use the data collector to download historical data
- Start a backtesting
- Analyse results
Selecting a profile to run in backtesting
Go to the profile selector on your OctoBot and select the profile you want to backtest.
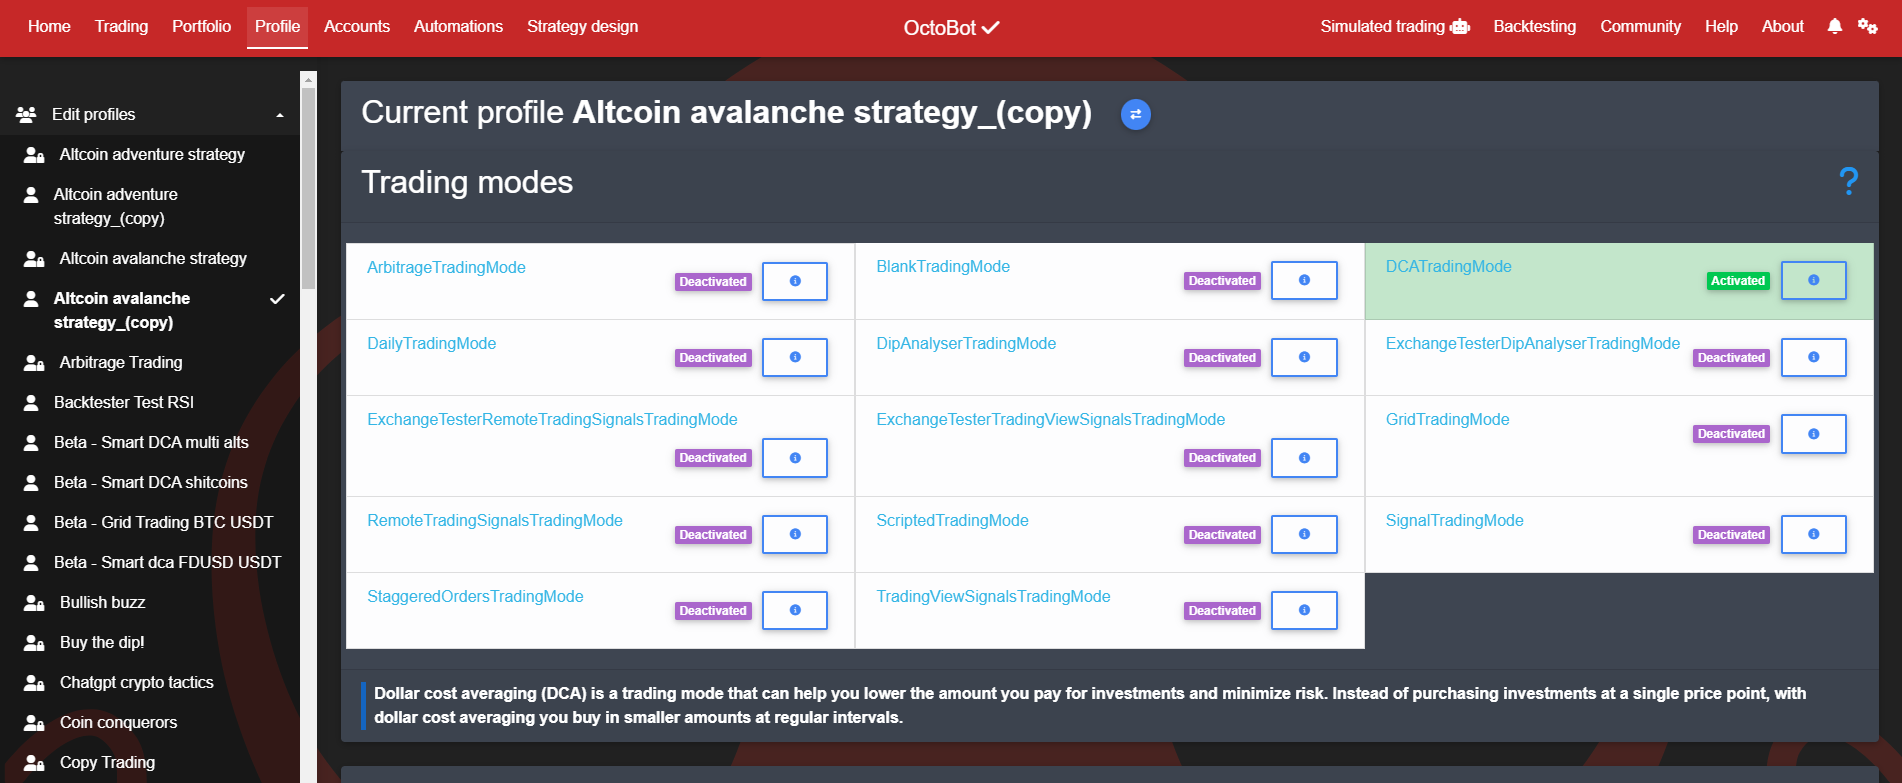
Trading modes, strategies and evaluators
In backtesting, OctoBot uses the most recent version of your selected trading mode, strategies and evaluators as well as their latest configuration.
This means that you can select different trading modes & evaluators and restart backtestings without having to restart OctoBot: your next backtesting will take your latest changes.
This is useful to quickly try different values of an indicator or any other configuration parameter.
Note: when backtesting a strategy, prefer selecting a profile using paper trading (use the trading simulator), this way any change you make won’t affect your real trading profiles.
Initial portfolio
Similarly to simulated trading, your backtesting initial portfolio is built using the configured Starting-Portfolio in your profile.
When running a backtesting, make sure you configured your start portfolio with enough funds for your strategy to be able to trade. Don’t forget to add some BTC when trading against BTC for example.
Traded assets settings in backtesting
- Coins: Selected coins and pairs are ignored as the datafile you will select to run your backtestings will provide the traded pairs
- Reference market: The selected reference market will change to the common quote of your datafile traded pairs if there is a common quote. Ex: a datafile with BTC/USDT and ETH/USDT will force its reference market to USDT to compute profits from USDT
Download historical data
Using the data collector, available from the backtesting tab, you can download historical data from most crypto exchanges.
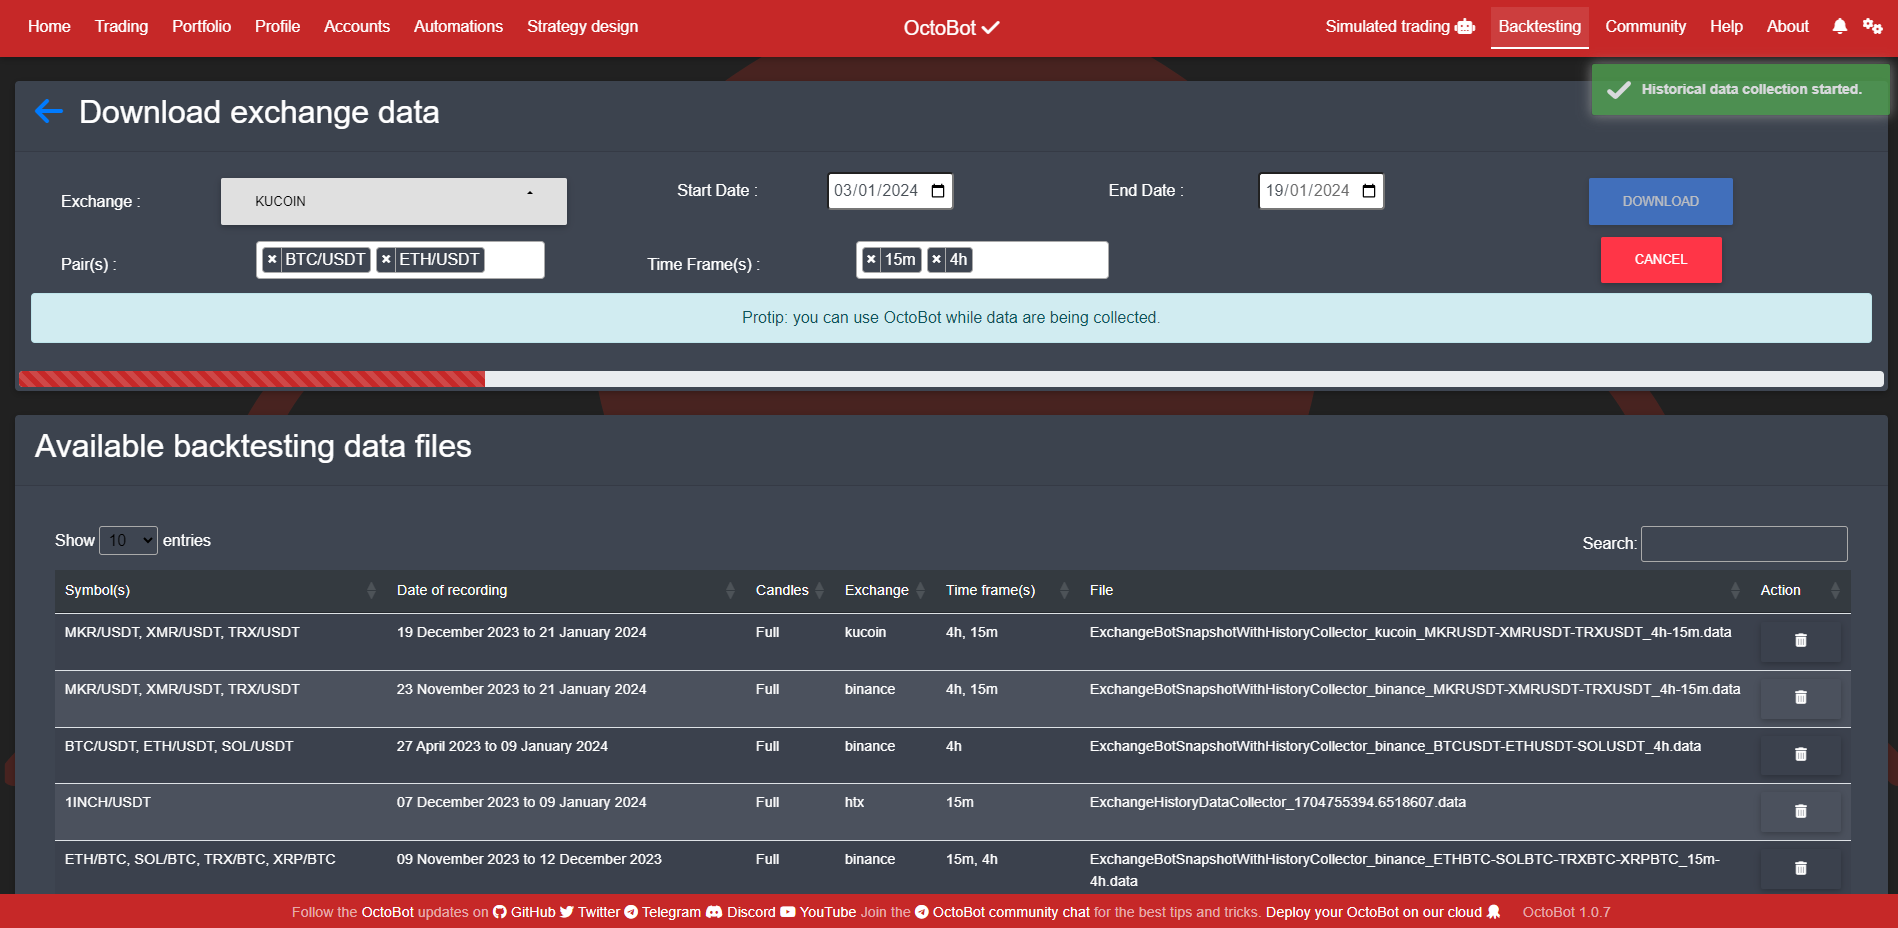
You can download data from multiple trading pairs and timeframes at the same time. When using such files, backtesting will run your strategy on each available pair and use the timeframes that are required in its configuration.
Full History exchanges
When selecting historical data to download, exchanges are split into 2 categories: Full History and Other. Here are the differences.
Full history exchanges allow to download historical data on a selected time range. When doing so, each candle from each timeframe on each symbol will be downloaded for the selected time range. This means that when selecting a time range:
- Downloaded history is complete for each candle on the selected time range
- The download process can be slow if you selected a large total amount of candles
- Full history data files are marked as
Fullin the datafile selector
Warning: not selecting a time range in Full history exchanges will default to downloading the latest candles only, similarly to Other exchanges.
Other exchanges are exchanges that do not (currently) allow to download historical data. This means that:
- Only the most recent candles will be downloaded (usually the last 500 candles)
- Selecting short and large timeframes at the same time will result in short backtestings as a backtesting only run on available candles. Ex: a backtesting data file containing the last 500 1 minute candles and the last 500 daily candles will only run on the past 500 candles, which is less than a day.
- Data files of this type as displaying their candle count in the datafile selector
Overall, it is better to use Full history exchanges and select the time range to run your backtesting on.
Starting a backtesting
Once your data file is downloaded, select it and start your backtesting.
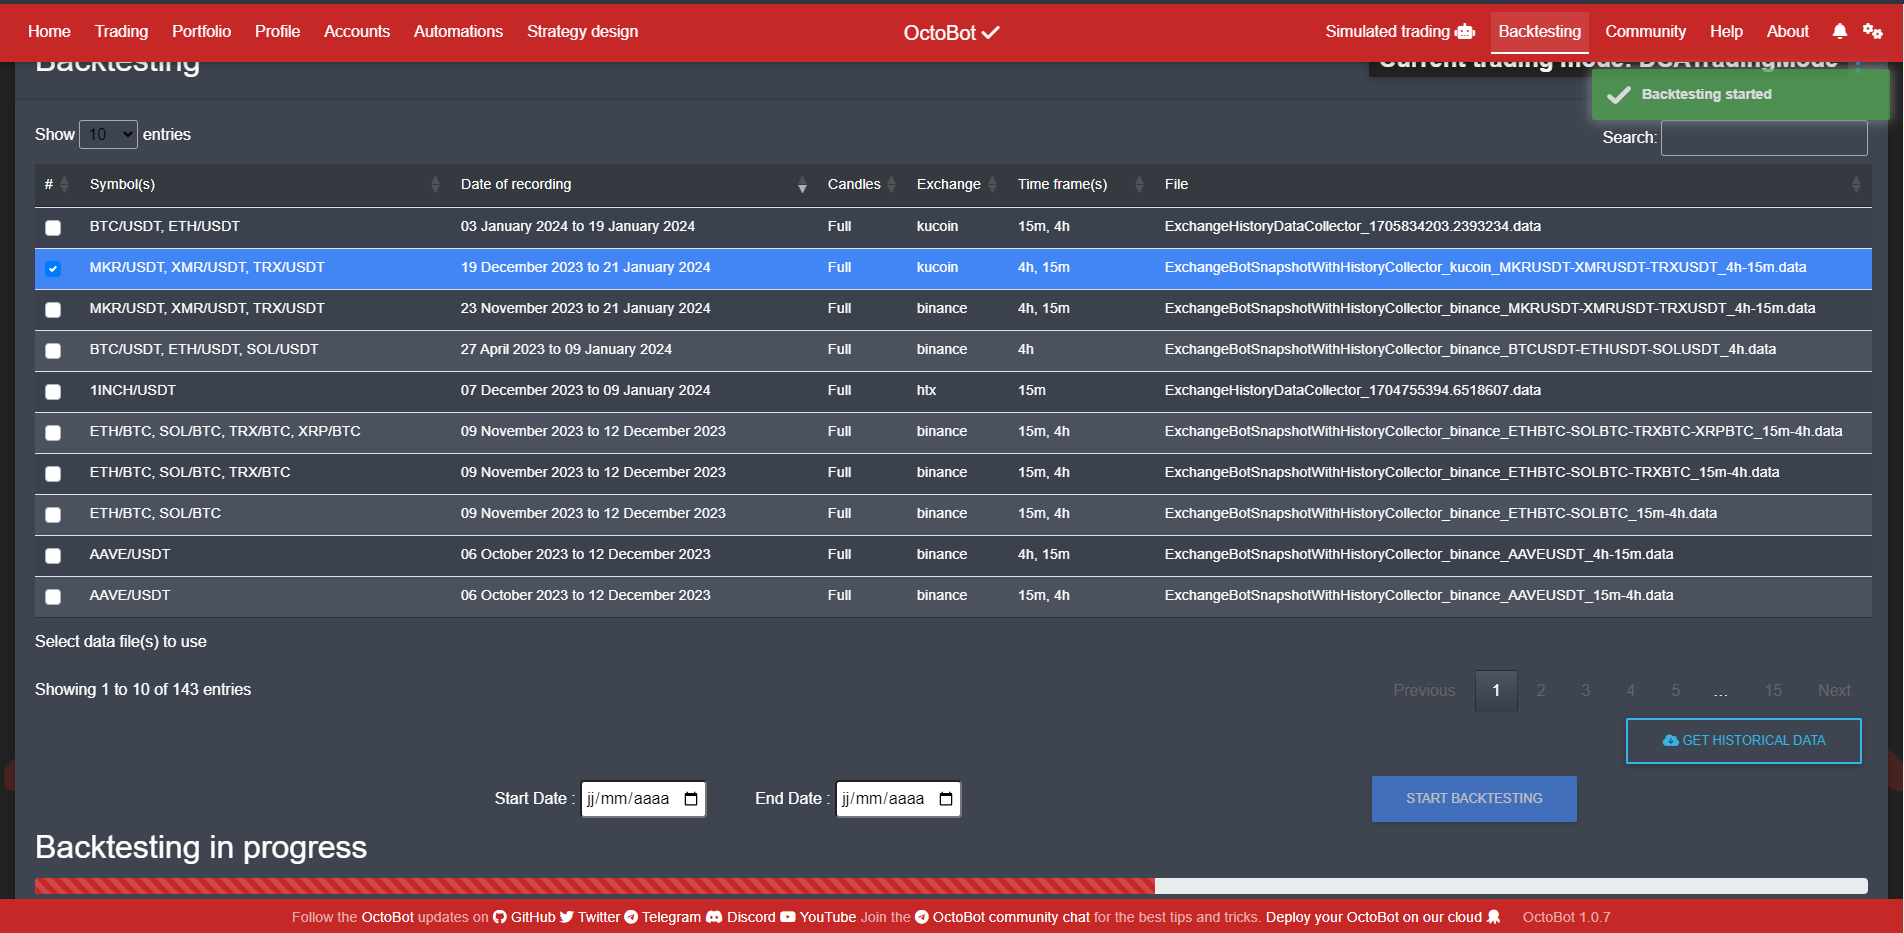
Backtestings usually last a few seconds and run in the background, if you want, you can do something else with your OctoBot while a backtesting is running.
You are notified once your Backtesting is complete.
Analysing results
You can access your backtesting results from the backtesting tab. Your backtesting report is below the data selector. In this report, there is a summary of your backtesting profits, charts which historical prices, trades and open orders as well as a trades explorer.
Profitability

This summary shows your profitability running this strategy on this time range.
- Bot profitability is the profits in % of the reference market your strategy made.
- Market average profitability the average profitability of your traded markets. It’s given as a comparison of the profits you would have made if you were having a permanent 100% exposure to your traded assets, which is extremely risky. It corresponds to equaly splitting your initial funds into those assets and holding them during the whole backtesting time.
- Symbol profitability is the profitability of each traded pair during backtesting time.
- End portfolio is the content of your portfolio at the end of the backtesting.
- Starting portfolio is the content of your portfolio at the start of the backtesting.
- Reference market is the backtesting reference market (used to compute profitabilities)
Historical charts
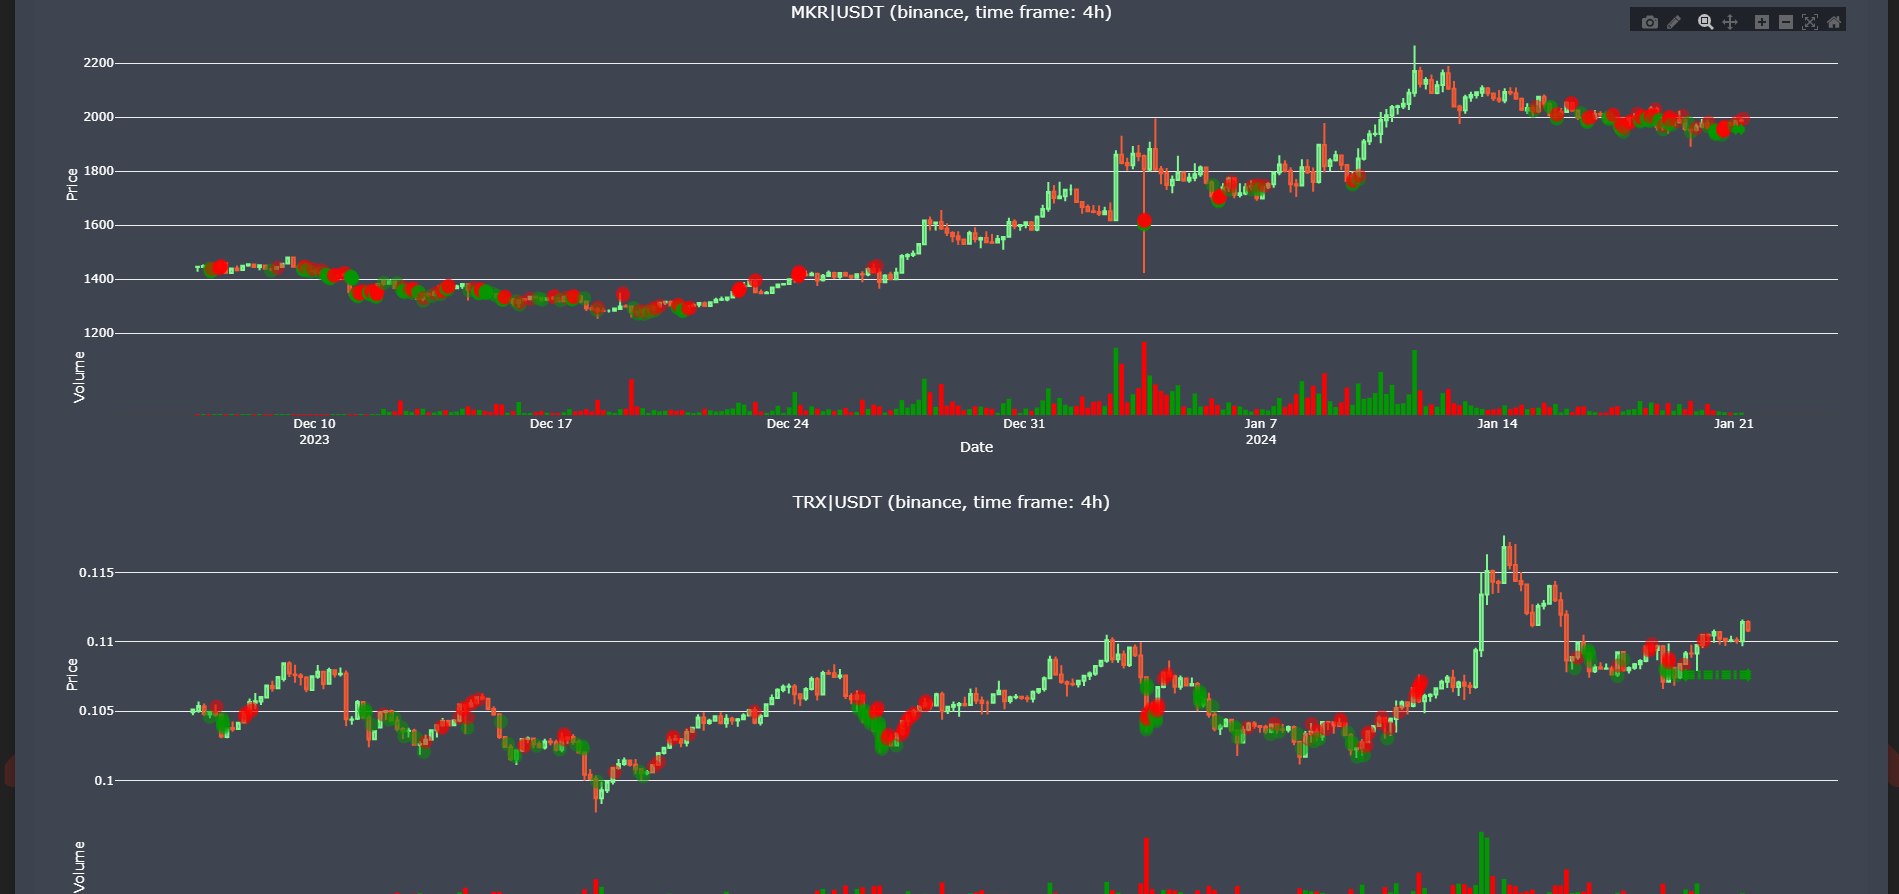 For each traded pair, a historical chart will be displayed. Those charts are interactive and you can select the time frame to be used. On large backtestings, selecting a longer timeframe can be easier to read. Each chart features:
- Historical candles and trading volume
- Trades made using backtesting
- Pending open orders at the end of the backtesting
Historical trades
 Each trade executed during a backtesting is available in the trades explorer where you can easily filter and sort trades to understand how your strategy behaves.
Going deeper with the Strategy Designer
Backtesting as presented on this page is the basic, yet very complete already version of the Strategy Designer available on OctoBot cloud plans.
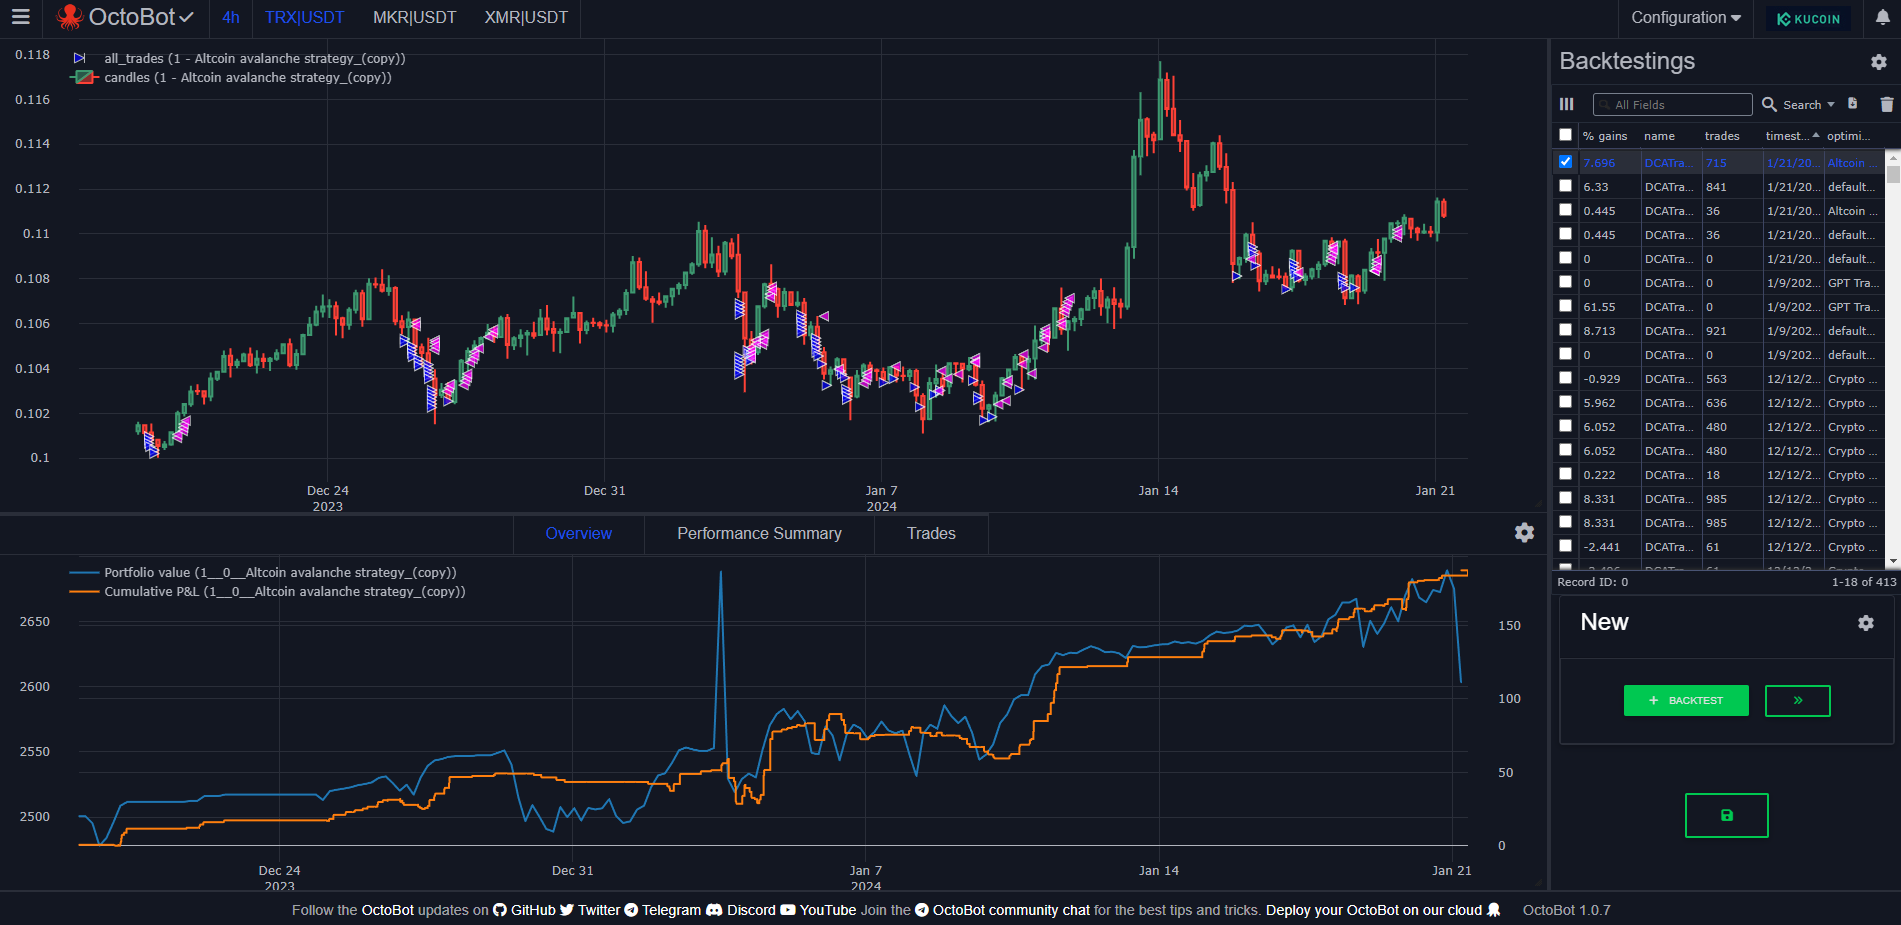
The strategy designer allows you to do everything the regular backtesting does and alows adds:
- Access the history of your backtesting runs
- Charts to analyse your backtesting runs more efficiently with historical portfolio value, PNL and more
- The capability to compare your backtesting results between runs
- Backtesting only profiles to backtest without affecting your current live trading profile
- And much more …
If you are already backtesting your strategies and would like to use a more powerful tool, we strongly suggest to have a look at the Strategy Designer.
How backtesting works inside OctoBot
Backtesting vs live trading
When running in backtesting, OctoBot uses the same code to execute a trading strategy as when running it live. This means that results of running a strategy in backtesting and live are identical as long as the input data is also identical.
As backtesting runs using complete candles, there might be a difference with live trading as live trading could access incomplete candles to run its indicators (this is the case with real-time evaluators for example). Therefore, in backtesting realtime evaluators can’t run the same way they do in live trading because in-construction candles are not available.
For the same reason, as only candles data are available, backtesting on strategies that run on other data than candles data (following google trends for exmaple) is currently impossible.
The only exeption is ChatGPT historical signals that are made available for free thanks to OctoBot cloud when running a backtesting using the ChatGPTEvaluator on traded pairs and time frames used by OctoBot cloud strategies that are also using the ChatGPTEvaluator.
Time management
Backtesting works by executing a strategy using past data. Therefore when running a strategy, the backtesting engine simulates the passage of time from the start of your backtesting data to the end.
Backtesting will iterate from candles to candles and each iteration will:
- Update the current candle for each traded pair and timeframe
- Check if open orders should be filled given the new price data
- Trigger a evaluation cycle for each trading pair:
- Push new candle(s) to evaluators
- Trigger strategies to sum up evaluators outputs
- Trigger trading modes to create or cancel orders
- Check if orders should be filled instantly (ex: market orders)
Multiple traded pairs
When selecting a datafile with multiple trading pairs, at each new time tick, associated candles (if any) will be push to evaluators. This happens sequentially, one pair after another.
Filling orders
In backtesting, OctoBot has access to historical candles only. This means that to figure out if an order should be filled, it will have a look at the most recent candle.
You can improve the accuracy of orders fills in backtesting by selecting a short time frame in your datafile. It will make your backtesting slower but it might be useful if orders execution must be accurate in time.